User guide
Account and profile
How to create an account
Nothing is easier:
- Go on the SSHADE website https://www.sshade.eu/
- Click on “Log in” at the top left of the web page
- Click on “Create an account”
- Fill in your email adress
- Go to your mailbox and click on the link you received (it can happen in your spam folder)
- Choose your personnal password
Congratulations!, your are now a SSHADE user.
How to configure your profile?
When you have a SSHADE account and log in, you can edit your user profile. Click on “User” in the top toolbar and then choose “User Profile”. Inside your profile, you have two different parts, each part is optional and you are free to fill them.
Identity (1)
Just after creating your account, you can see your e-mail address and your current status on SSHADE.
- You can edit your profile and provide your name and ORCID number.
- You have an option to change your password.
Laboratory (2)
- This part contains information about your laboratory/organization, and you are free to inform it.
How to use my dashboard
“Not yet active”
SSHADE structure and navigation
SSHADE structure
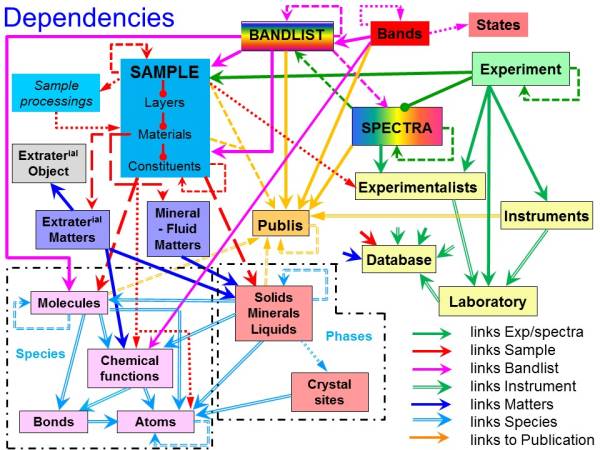
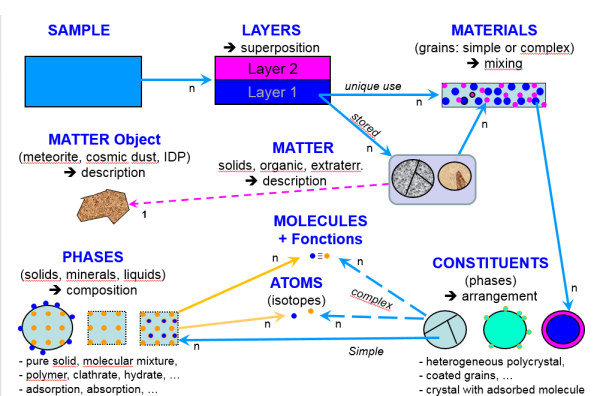
All data on SSHADE is highly interconnected (through the SSDM datamodel). Each spectrum stored in SSHADE is linked to many other data that contribute to the generation of spectrum metadata. It includes data on the laboratory, experimentalists, instruments, publications, samples, environmental and experimental parameters. The complete network of links is illustrated below:
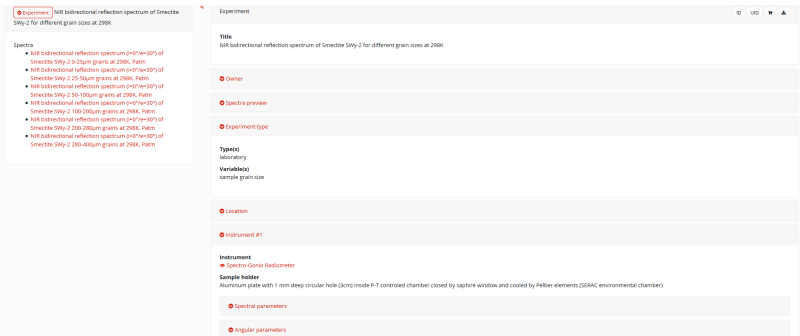
To help you explore all the information around a spectrum, navigation on SSHADE works with a pair of trees and internal links between each metadata. These trees will help you to quickly explore the different information on experiments, spectra, and samples.
- In SSHADE, an experiment is a single study or a collection of several similar studies. It contains one or more spectra.
- The experiment provides global information on the set of spectra.
- The spectrum contains its spectral, angular, polarization and spatial information, and a link to its sample.
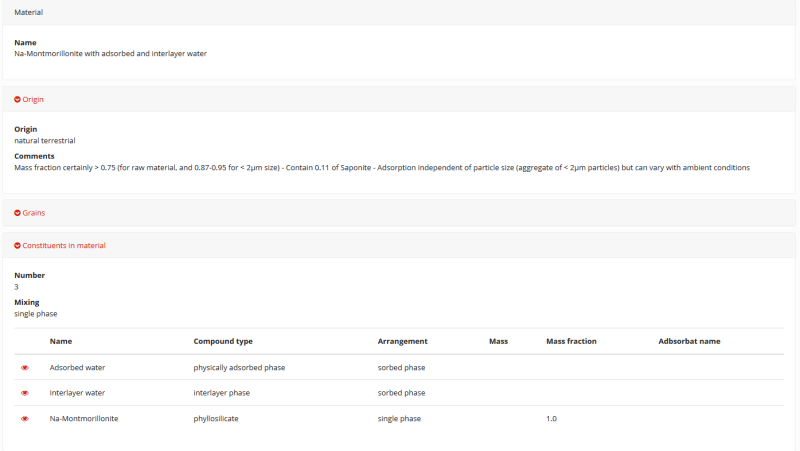
- The sample contains all the physical, chemical and environmental information on the materials measured.
- They are all linked to a set of global information (database, laboratory, publication, documentation, experimentalists, …).
- Here is an Example.
How to navigate
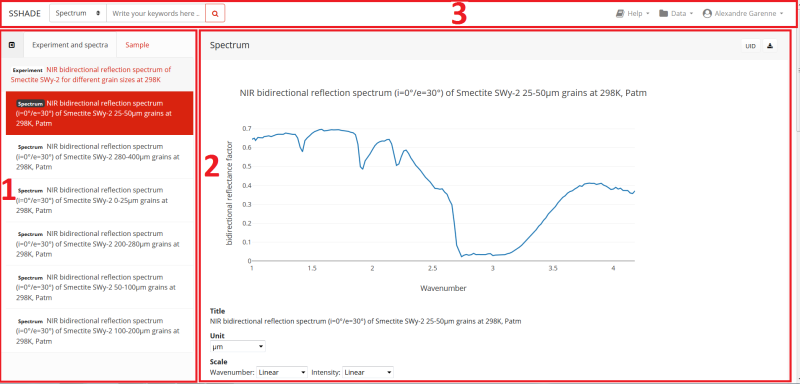
The SSHADE interface for exploring an experiment consists of three main parts:
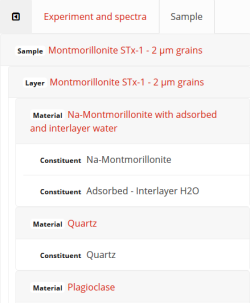
- On the left side: “Experiment tree” and “Sample tree”. They display the title of the experiment and its spectra, as well as the name of the sample and its layer / material / constituent (See Sample metadata for a description of the sample structure). This is the main tool for navigating between metadata in an experiment. It can be folded/unfolded by clicking on the '«' symbol at its top left.
- On the right side: The screen of spectrum and metadata. It displays folded blocks (some open by default) that you can open to see the information you want. Each red “eye” is a direct link to another metadata page that opens either on the right side when it belongs to a tree element, or as a pop-up window for any other internal link. All links with another experience and all external links are opened in another tab.
- The toolbar and search bar at the top are always available to start a new search.
The Experiment and Sample trees
The Experiment and sample trees are the core of the navigation on SSHADE. The sample tree adjust when you navigate from one spectrum to another.
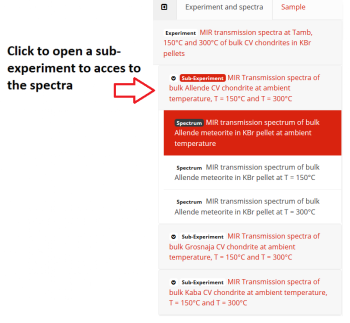
- The experiment tree may contain the spectra, or sub-experiments that contain the spectra. Their title reflects their respective content. They can be un/folded with a single click.
- When you click on a spectrum title, the spectrum page is displayed on the right and the sample tree is updated with the sample on which the spectrum was measured.
- The sample structure is unfolded by default down to the material level. Each block of material can be unfolded to access all its constituents. Remember that the sample displayed is the one on which the activated spectrum was measured.
- You can quickly show right all the detailed information about the experiment, spectrum or any level within the sample structure by simply clicking on their title or name in the trees.
- You can find a description of the main metadata pages in the following sections.
Experiment Metadata
The metadata of the experiment contain:
- Links to the database, the laboratory and the experimentalist(s) of the experiment
- A static preview of a selection of spectra of the experiment
- Information on the parameter(s) varying between the different spectra of this experiment
- A link to the instrument used, and the instrumental parameters used for the experiment
- A link to the associated publication
Spectrum Metadata
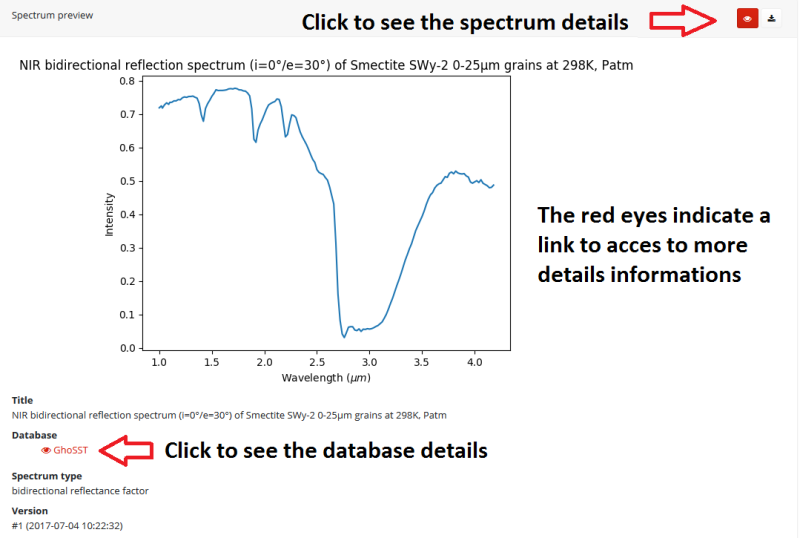
There are two kinds of display for a spectrum, a summary page and a detailed page. When you click on a spectrum title, its summary page is first displayed.
The summary page contains condensed information about the spectrum and the sample:
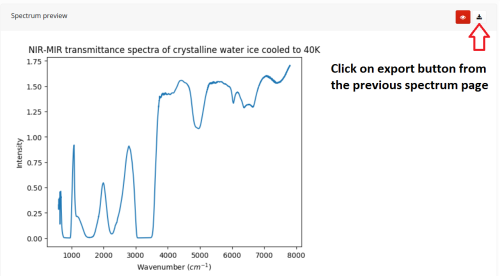
- A preview of the spectrum
- The name, type and version number of the spectrum plus its database
- A summary of the instrument (link) and spectral range used
- A summary of the sample (name, origin, texture and thickness) and environmental parameters (temperature, pressure)
- For more details on the sample, click on the name of the sample either on this page or in the sample tree.
- For more details on the spectrum, you must click on the 'eye' at the top right of the page
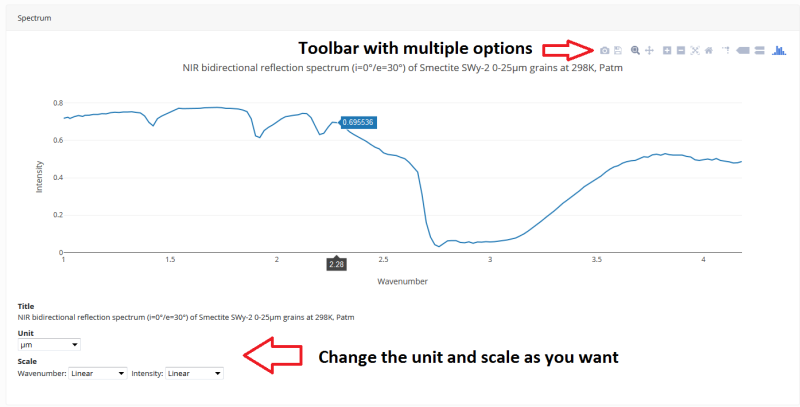
This action will update the metadata page with an interactive plot of the spectrum and its differents options:
- A plot toolbar (zoom, pan, reset, …) is displayed top right when your mouse is over the plot
- You can change the unit of the spectrum (µm, nm, cm-1…) as well as the type of scale (linear or logarithmic) for both axes. The spectrum will be automatically updated.
The blocks below give you access to all the information about the spectrum and related metadata:
- Links to the database, and experimentalist(s)
- Some information about the spectrum, its history (date, version, …) and its analysis
- A link to the instrument(s) and the instrumental parameters used for the spectrum
- A link to the measured sample
- A link to the associated publication(s)
Sample Metadata
The precise description of the sample is a central part of SSHADE. The objective is to have very detailed information on its composition, its physical properties and its environment, as well as on its preparation. Anything that can impact the spectrum can be described in SSHADE.
The description of the sample is therefore complex but well structured in several levels.
- A solid sample may have one or more layers added to each other. It has macroscopic physical characteristics and can be exposed to different environmental conditions (temperature, pressure, fluid, irradiation, …)
- A layer is formed under particular conditions (formation mode, T, P, …) and is described by specific physical characteristics (thickness, texture, porosity, …). Each layer is composed of one or more materials mixed at the grain level (such as salt and pepper).
- A material has an origin, and is mainly defined by a texture and grain sizes, and its abundance in the layer. Each material is composed of one or more constituents (eg minerals) mixed within a grain or rock.
- Natural “materials” can be composed of several materials and their description contains additional information on their natural origin, collection or preparation.
- A constituent is usually a single phase (such as a mineral phase, solid or liquid). It is described by its abundance inside the grain / rock material, its chemical composition (atomic, molecular, isotopic, …), its crystallographic structure and certain physical properties (for example density, refractive index). In addition, we have described all the chemical bonds and functions present, mainly in molecular solids.
The sample page can also contain a “Sample Processing” block that chronologically describes the different steps to produce the sample (the “cooking recipe”).
Export
How to export
You can browse freely on SSHADE, but if you want to export a spectrum, you must create an account and log in (see How to create an account section for more details). After logging in, you have the option to export spectrum files.
Two ways to export a spectrum:
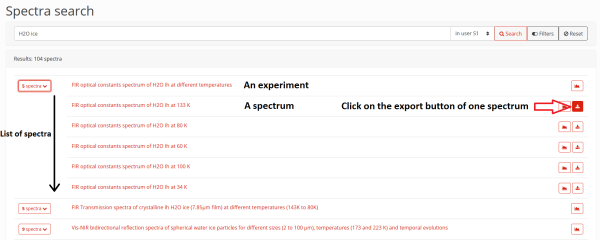
- Directly from the search results page by clicking on the export button to the right of each spectrum. To export a spectrum of an experiment, you must first unfold it. You can then export the spectrum you want in the spectrum list.
- From the preview or detail pages of the spectrum, by clicking on the export button at the top right of the page.
Two ways to export an experiment with all its spectra:
- Directly from the search results page by clicking on the export button to the right the experiment.
- From the detail pages of the experiment, by clicking on the export button at the top right of the page.
Note: the ability to export a complete experience with all its spectra will be available soon.
The export archive
The export system provides you with an archive (.zip) containing 7 different files:
- A preview of the spectrum in the original units
- An ASCII text file containing data usage rules, data DOI, and data and paper references to quote
- A pdf file containing the information of the experiment
- A pdf file containing the information of the spectrum
- A pdf file containing the information of the sample (with its structure)
- The spectrum data file (ASCII)
- A file giving some information on the content of the files above and on the spectrum format
Request
How to make a request
“Not yet active”

